I built a clickstream ingestion pipeline on AWS to familiarize myself with real-time data processing and analytics. The project connected API Gateway, Kinesis Data Firehose, Lambda, S3, Athena, and QuickSight into a working architecture for transforming, storing, and visualizing clickstream data.
Architecture Overview
The workflow was:
- Amazon API Gateway accepted HTTP POST requests from a simulated front end
- Amazon Kinesis Data Firehose ingested events and applied a Lambda transformation function
- Lambda (Python) reformatted records to ensure each event was written on a new line for downstream querying
- Amazon S3 stored the transformed data in JSON format
- Amazon Athena queried the ingested records using a partitioned schema
- Amazon QuickSight visualized the clickstream data with dashboards and charts
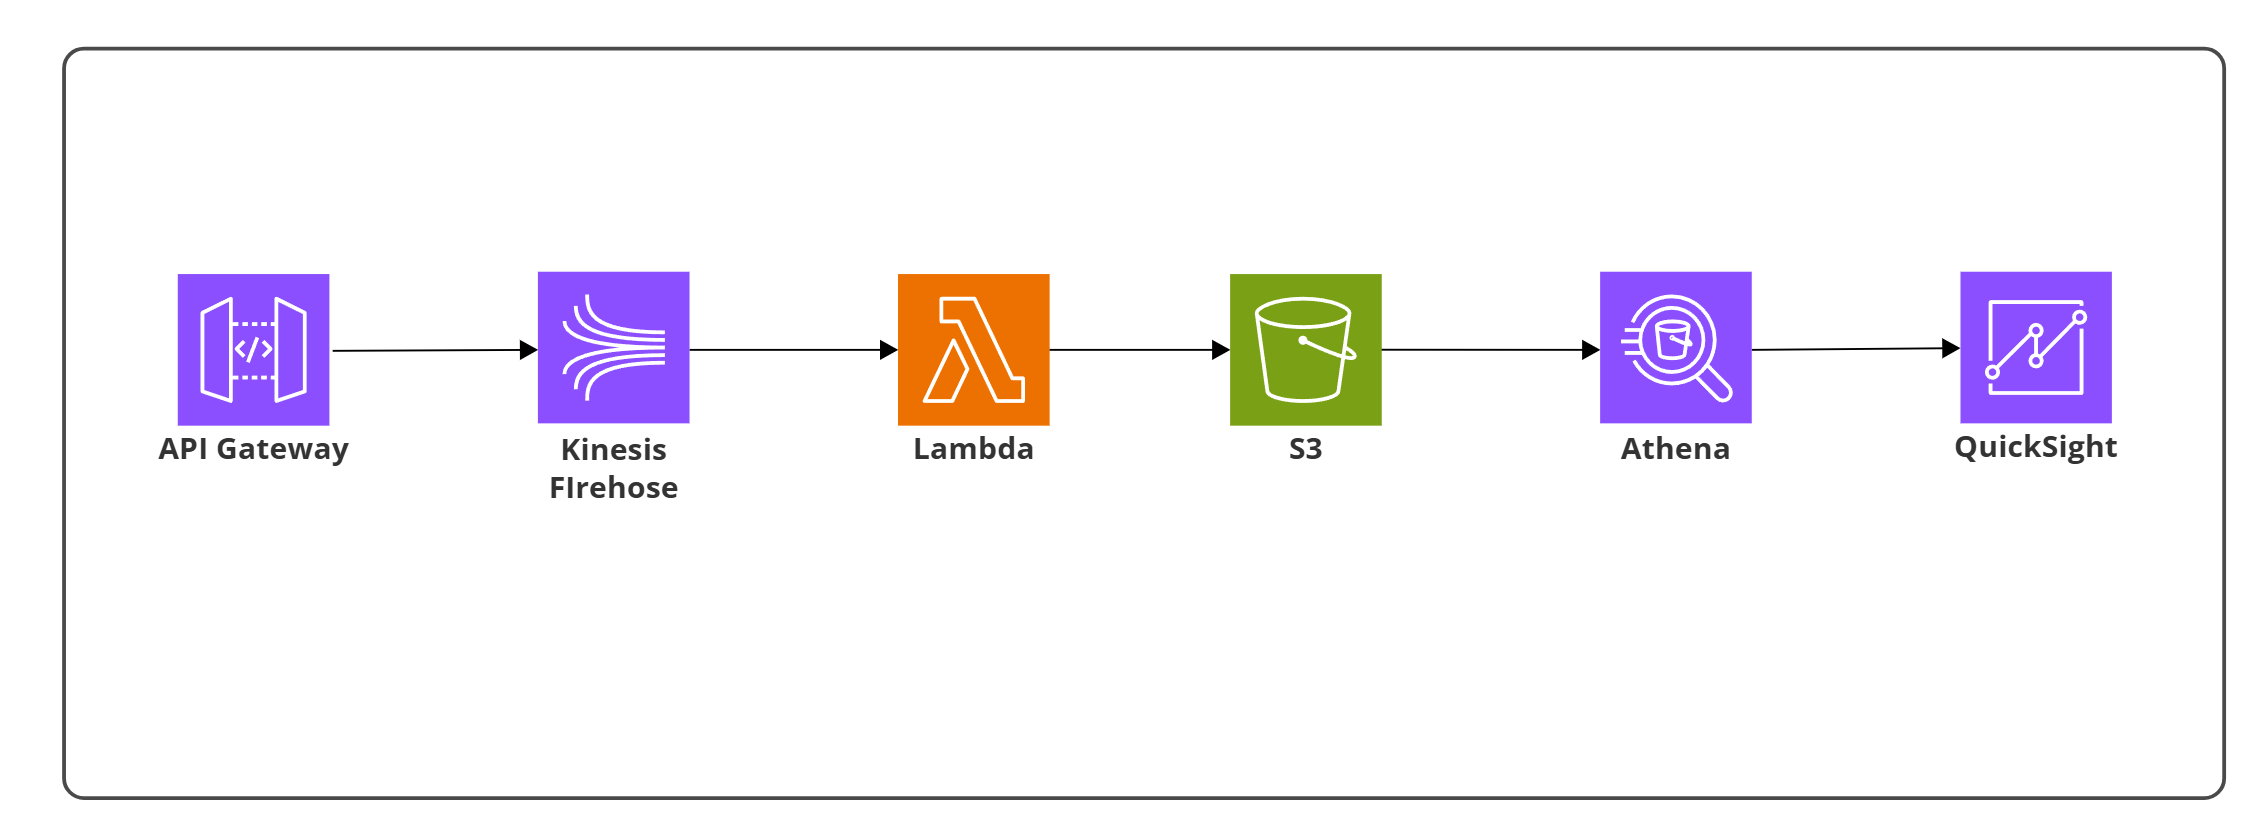
Clickstream ingestion pipeline diagram built with API Gateway, Firehose, Lambda, S3, Athena, and QuickSight using Cacoo.
IAM Policies and Roles
I set up execution roles and custom IAM policies to enforce least-privilege access:
- API-Firehose role: allowed API Gateway to call the
PutRecordAPI on Kinesis Firehose - Firehose-S3 role: granted Firehose permission to deliver data into the S3 bucket
- Lambda Execution Role: enabled Lambda to process and log events to CloudWatch
Lambda Transformation
I created a Lambda function (transform-data) from a Firehose blueprint in Python 3.8. Its responsibilities included:
- Decoding incoming Firehose records
- Appending newline characters to each event for proper row separation
- Re-encoding and returning transformed data back to Firehose
This ensured downstream tools like Athena could parse the dataset correctly.
Data Storage & Querying
- Amazon S3 served as the central storage layer, with data partitioned by date.
- Amazon Athena was configured with an external table mapping to the S3 bucket, using JSON SerDe for parsing.
- Ran queries such as
SELECT * FROM my_ingested_data;to validate that clickstream events were stored and formatted properly.
Visualization with QuickSight
I connected QuickSight to Athena and created visualizations on the ingested clickstream data:
- Imported the Athena dataset into SPICE for faster analytics
- Generated charts (e.g., pie charts by
element_clicked) to validate data distribution - Explored different visual types for analyzing clickstream patterns
Testing & Verification
I simulated clickstream events by posting JSON payloads through API Gateway (e.g., element_clicked, time_spent, restaurant_name, created_at).
- Verified status
200responses from API Gateway → Firehose integration - Confirmed transformed data in S3 partitions
- Queried results successfully in Athena
- Built dashboards in QuickSight for end-to-end validation
Takeaways
This project helped me strengthen my skills in real-time data pipelines on AWS. I learned how to:
- Integrate API Gateway, Firehose, Lambda, S3, Athena, and QuickSight into a connected architecture
- Implement data transformation within Firehose using Lambda
- Manage IAM roles and bucket policies to enable service-to-service permissions
- Use Athena for serverless querying of JSON data
- Build lightweight QuickSight dashboards for interactive visualization
Overall, this was valuable practice in building a streaming ingestion workflow and connecting multiple AWS services into a functional, serverless analytics pipeline.